Enhanced Forex IndicatorDescription of the "Enhanced Forex Indicator"
The "Enhanced Forex Indicator" is designed for traders who want a comprehensive technical analysis tool on the TradingView platform. This script integrates Exponential Moving Averages (EMAs), support and resistance zones, and candlestick pattern recognition to provide actionable trading signals, particularly useful for Forex and other financial markets. The script is suitable for intraday trading and swing trading.
Components of the Indicator
Exponential Moving Averages (EMAs):
Short EMA (Blue Line): Faster responding average, good for identifying recent trend changes.
Long EMA (Red Line): Slower moving average, helps in confirming longer-term trends.
Support and Resistance Zones:
Resistance Zone (Red): Area where potential selling pressure could overcome buying pressure, halting price increases temporarily or reversing them.
Support Zone (Green): Area where potential buying pressure could overcome selling pressure, supporting prices and preventing them from falling further.
Candlestick Patterns:
Bullish Engulfing Pattern (Green Triangle Up 'BE'): Suggests a potential upward reversal or start of a bullish trend.
Bearish Engulfing Pattern (Red Triangle Down 'BE'): Indicates a potential downward reversal or start of a bearish trend.
Buy/Sell Signals:
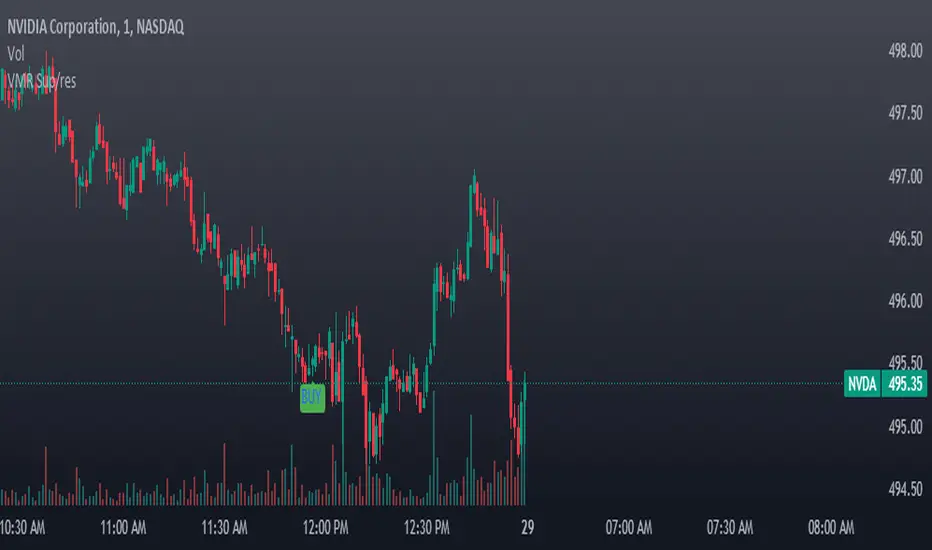
Buy Signal (Green Label 'BUY'): Triggered when the price is above both EMAs and a bullish engulfing pattern is detected.
Sell Signal (Red Label 'SELL'): Triggered when the price is below both EMAs and a bearish engulfing pattern is detected.
Trading Setup:
Entry: Consider entering a buy position when the 'BUY' signal appears, indicating bullish conditions. Enter a sell position when the 'SELL' signal appears, indicating bearish conditions.
Exit: Look for closing signals opposite your entry or use predefined take profit and stop loss levels. For instance, exit a buy position on a 'SELL' signal or when the price drops below the support zone.
Risk Management:
Set stop losses just below the support zone for buy orders and above the resistance zone for sell orders to protect against significant losses.
Adjust position sizes according to your risk tolerance and account balance.
Considerations:
Use this indicator in conjunction with other analysis tools and fundamental data to confirm signals and strengthen your trading strategy.
Periodically backtest the strategy based on this indicator to ensure its effectiveness in current market conditions.
Optimization:
Adjust the lengths of the EMAs and the buffer size of the support and resistance zones to better fit the asset's volatility and your trading timeframe.
Cerca negli script per "the strat"

Holding Zone Input Parameters
The script has three input parameters:
· length: an integer input with a default value of 20, likely used for calculating moving averages or other indicators.
· zoneSize: a decimal input with a default value of 1.5, likely used to define the size of the "holding zone".
· entryZone: an integer input with a default value of 50, likely used to define the entry point for the strategy.
Calculate Holding Zone
The script calculates two values:
· highs: the highest high over the last length bars.
· lows: the lowest low over the last length bars.
Then, it calculates the zoneHigh and zoneLow values by subtracting/adding a fraction of the difference between highs and lows from/to highs and lows, respectively. This creates a "holding zone" between zoneHigh and zoneLow.
Plot Holding Zone
Finally, the script plots two lines:
· zoneHigh with a blue color and a linewidth of 2.
· zoneLow with a blue color and a linewidth of 2.
________________________________________________________________
For the 15 min timeframe I use the parameters 10 for the length, 0.5 for the zone size and 20 for the entry zone. this makes it more sensitive to price

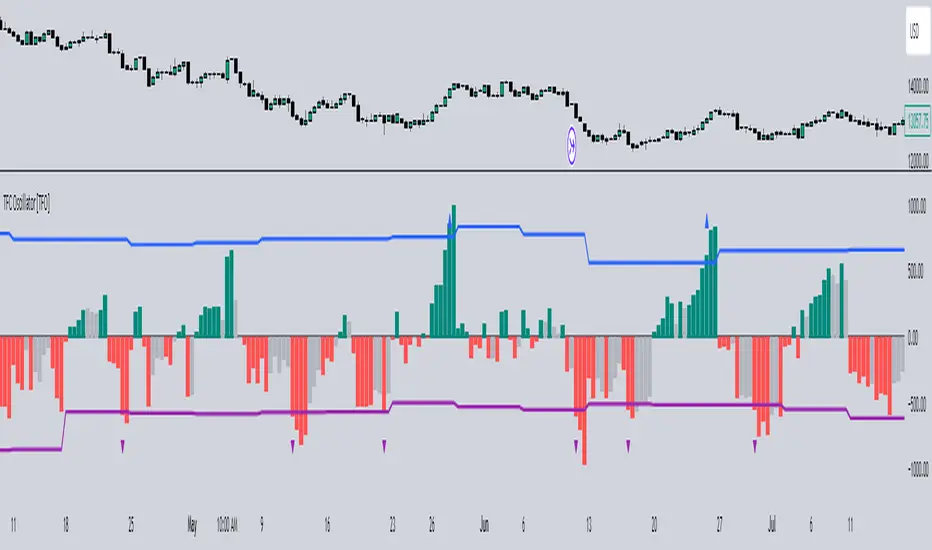
Timeframe Continuity Oscillator [TFO]This indicator is used to visualize timeframe continuity - a core concept of "The Strat" - along with some added logic for potential range limiters.
When discussing timeframe continuity, typically we are evaluating several timeframes to see if price is trading above or below the current open of each respective timeframe. If we are concerned with the 15m, 4h, and 1D for example, and price is trading above the current open of each of those timeframes, we can say that we have full timeframe continuity (FTFC) up. Conversely, if price is trading below the current open of each of those timeframes, we can say that we have FTFC down.
We can visualize this with an oscillator of sorts, where the zero line is anchored to the open price of the highest timeframe that we're concerned with. Using the prior example, this would be the 1D timeframe. As long as price is above the current 1D open, it is impossible to have FTFC down; and as long as price is below the current 1D open, it is impossible to have FTFC up. This is why we base the oscillator's values off of the highest timeframe's open (the values are simply how far price has traded from this open) - any value greater than zero tells us that there is potential to have FTFC up, and any value less than zero tells us that there is potential to have FTFC down.
There are a few ways we chose to visualize this data. First, we can choose the "Binary" option which simply uses one solid bullish color above the zero line, and one solid bearish color below the zero line.
Second, we can choose the "Gradient" option to help describe whether we have FTFC up or down. Values above the zero line will be a mix of the bullish color and mid color, where the mid color indicates no timeframe continuity up and the bullish color indicates FTFC up - sort of like a color spectrum of timeframe continuity to describe how many timeframes are in agreement. Similarly, values below the zero line will be a mix of the bearish color and the mid color, where the mid color again indicates no timeframe continuity down and the bearish color indicates FTFC down.
Lastly, we can choose the "FTFC Only" option which will only color the histogram bars as bullish if there is FTFC up, or bearish if there is FTFC down.
One more feature that we added is these upper and lower bands that aim to help describe the potential upper and lower limits that price may travel, relative to the highest timeframe's open. This is done by taking the standard deviation of some defined lookback period, for example, 2 standard deviations of the previous 10 weeks, assuming 1W is the highest timeframe enabled.
The concept is similar to that of an ADR (average daily range) as it can be used to estimate maximum range extensions for the largest timeframe. The arrows you see are plotted once the value exceeds either band - alerts can be enabled for these events as well through any alert() function call.
Greenblatts Magic Formula - A multiple approachThis indicator is supposed to help find undervalued stocks. Inspired by Joel Greenblatt's strategy where he ranks stocks with the lowest EV/EBIT and the highest ROC. Inspired by the ERP5 strategy I have added Earnings Yield together with ROC.
My approach and how I use the indicator is to see Magic Formula score as a multiple, rather than ranking the numbers between different stocks. Like P/E for comparison. Different kinds of companies trades at different multiples so you have to compare the current MF Score in relation to historical MF Score to get an idea if it truly is undervalued. You also want to see that price actually reacts to a low MF Score.
As i general rule for myself I stay away from companies with EV/EBIT above 13 and generally want to see MF Score below 6-7. A company trading at a negative MF Score indicates that the company may be heavily undervalued.
Red line = EV/EBIT
Green line = ROC + EY / 2
Yellow line = "MF Score" EVEBIT - (ROC+EY/2)
Blue line = The 50 EMA of MF score
The strategy is simple. Look for companies which might be undervalued. Compare the current MF score to it's history. If it's trading near a previous bottom it indicates that the company might be undervalued. You can also use the MF EMA to see a more smooth curve to interpret the multiple.

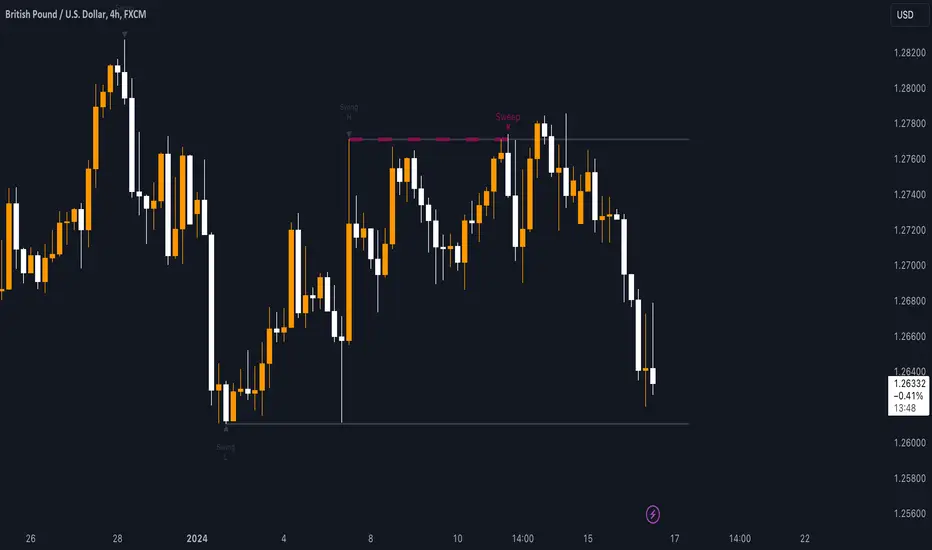
Sweep institutionalThis indicator focuses on identifying "SWEEPs" based on taking liquidity at highs and lows. The application of the SWEEP strategy is highly determinant in the Swing points, as they serve as the target of our operations.
ALERTS INCLUDED
🔹Example of Strategy Application
1.-Create the BULLISH SWEEP.
2.-You can enter LONG.
3.-If it is a BULLISH SWEEP, take a long with a SWING HIGH target (2-3 pips up).
4.-If it is a BULLISH SWEEP, place your SL behind the SWEEP (2-3 pips).
(This example is bullish, but it would be the same in a bearish setup, applying everything in the opposite way)
t's very crucial for the strategy to reference SWING POINTS, as these points will be our take profit and stop loss points.
The strategy is based on identifying a SWEEP. After this, we can look for trading opportunities with targets on the opposite side of the fractal. Remember, if you decide to enter, the Stop Loss should be placed protected by the Sweep, and the Take Profit should be set at the opposite Swing, as seen in the example.
Use this STRATEGY IN TIMEFRAMES GREATER THAN 30M. If you decide to use it in timeframes <30M, there's a higher probability of encountering false SWEEPs (the most optimal are 1h & 4h)
🔹Use
The Sweep strategy involves identifying potential trades based on the creation of a "SWEEP" (liquidity grab) at the Swing High or Swing Low. Below is an example of a bearish opportunity after taking liquidity from a Swing High with a wick and no candle body closing above it.
🔹Details
As you have seen, it indicates the surpassing of a high without the candle body, this is called a “SWEEP.” Each time this occurs, the price is likely to surpass the opposite SWING High/Low. The following example will show more clearly how it works in both bullish and bearish scenarios.
🔹Configuration
-Cooldown period: is the length of the operating Range line
-Swing detection: determines the points to be used as SL and TP protection
Bullish/Berish Sweep
-Line Width: size of the line
-Line Style: design type
-Color
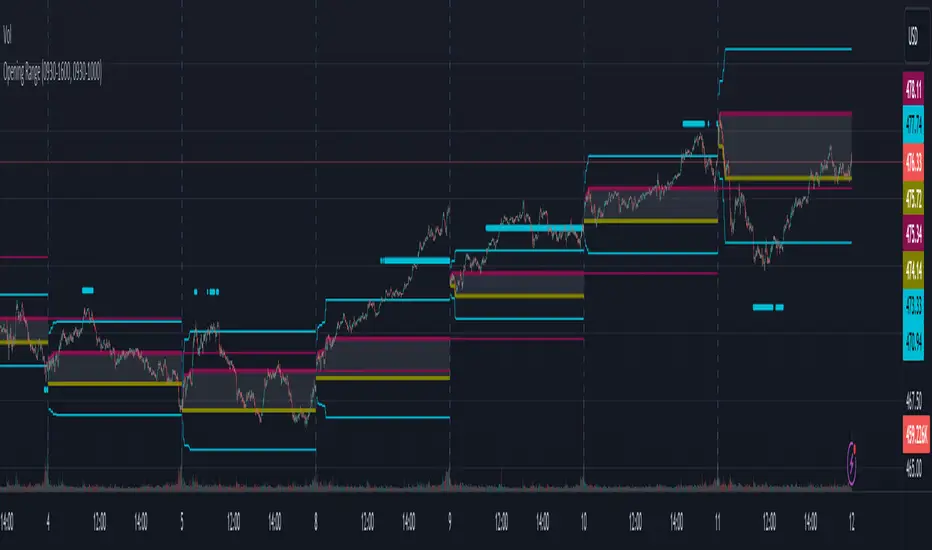
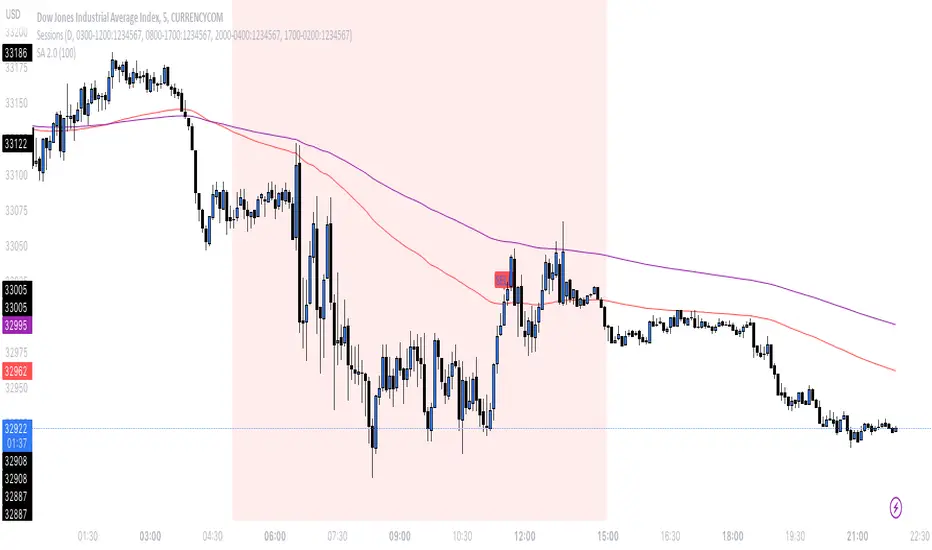
Opening RangeThe opening range or first 30 minutes of trading during the day sets the tone and becomes an important reference through the rest of the day. Price will react as it reaches the high and low of the opening range.
Backtesting has shown that the strategies based on the opening range have merit and provide an edge in trading. By not being aware of these points of reference you put yourself at risk.
In addition to the opening range, the distance from the high or low of the opening range plus the width of the opening range forms another important reference point.
Opening Range Rules.
Price must break out of the opening range in order to have a trending day. As long as price is inside the opening range, expect the trade to be choppy.
Once price leaves the opening range the market can begin to trend. However, before it trends most times it will retest the boundary of the opening range. This is a critical point, and a better than average entry for a position to join the trend. However, if price closes back inside the opening range watch out. Re-entry to the opening range has a high probability of going to the middle of the opening range, and a better than average probability of crossing the entire opening range.
In the above chart we can see price broke below the opening range then returned to retest the opening range before beginning a downward trend that delivered 175 pts on NQ.
Upon re-entering the opening range price tried to break down again but ultimately traveled up until it hit the 50% mark of the opening range.
Once a trend has begun the first target is the green line which is 1 width of the opening range outside of the opening range.
Once price broke out of the opening range to the upside, it came back to retest the opening range high, before beginning an uptrend that delivered 120 pts on NQ.
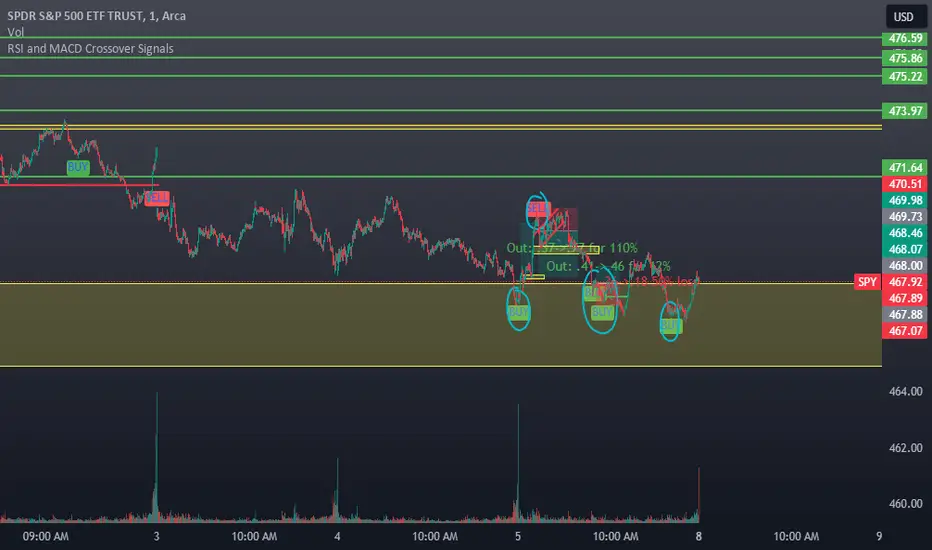
RSI and MACD Crossover SignalsBest for Short-Term/Intraday Trading on SPY, TSLA, NVDA
Strategy Concept:
This strategy is designed for short-term trading across various assets and timeframes (Recommend: 1min, 5min, 15min, 1hr, 4hr, 1day). It leverages the Relative Strength Index (RSI) and Moving Average Convergence Divergence (MACD) to identify potential buy and sell signals. The strategy aims to capture moments where the asset's price is likely to experience a reversal or a significant momentum shift.
By combining the RSI and MACD indicators, the strategy seeks to increase the accuracy of identifying potential trend reversals or continuations, taking into account both the momentum and the trend direction of the asset.
RSI (Relative Strength Index) Parameters:
The RSI period is set to 14
Overbought and oversold levels are set at 70 and 30, respectively
The RSI is used to identify potential reversal points when the asset is overbought or oversold
MACD (Moving Average Convergence Divergence) Parameters:
The MACD settings are configured with a fast length of 8, a slow length of 34, and a signal smoothing of 8
The MACD line crossing over or under the signal line is used to confirm the potential buy or sell signals indicated by the RSI
Signal Generation Logic:
Buy Signal:
Triggered when the RSI crosses above the oversold level (30).
Confirmed if the MACD line crosses above the signal line within a delay period of up to 4 candles after the RSI signal.
Sell Signal:
Triggered when the RSI crosses below the overbought level (70).
Confirmed if the MACD line crosses below the signal line within a delay period of up to 4 candles after the RSI signal.
Additional Features:
The script includes a notification system that alerts the trader when either a buy or sell signal is detected. The alert signal is combined with both the buy and sell signal in 1 so people without premium can be alerted when any signal appears.
Buy signals are visually represented on the chart below the price bars with a green "BUY" label.
Sell signals are indicated above the price bars with a red "SELL" label.
Usage and Application:
This strategy is versatile and recommended to be played with scalps and day trades. I prefer SPY 0DTE on the 1 and 5 minute timeframe and looking for bigger trend reversals on the 1hr, 4hr, and 1 day timeframe.
VWAP, MFI, RSI with S/R StrategyBest for 0dte/intraday trading on AMEX:SPY with 1 minute chart
Strategy Concept
This strategy aims to identify potential reversal points in a price trend by combining momentum indicators (RSI and MFI), volume-weighted price (VWAP), and recent price action trends. It looks for conditions where the price is poised to change direction, either bouncing off a support level in a potential uptrend or falling from a resistance level in a potential downtrend.
By incorporating both price level analysis (support/resistance) and momentum indicators, the strategy seeks to increase the likelihood of identifying significant trend reversals, taking into consideration both recent price movements and the current price's position relative to historical highs and lows.
VWAP (Volume-Weighted Average Price)
VWAP acts as a benchmark to determine the general market trend. It's an average price weighted by volume.
A price above VWAP is often considered bullish, and a price below VWAP is seen as bearish.
MFI (Money Flow Index) and RSI (Relative Strength Index) Parameters
MFI is a volume-weighted RSI, used to identify overbought (above 70) or oversold (below 30) conditions.
RSI is a momentum indicator that measures the magnitude of recent price changes to identify overbought or oversold conditions, similar to MFI.
The script uses standard overbought (70) and oversold (30) thresholds for both MFI and RSI.
Trend Check Function
The function trendCheck analyzes the past pastBars candles to count how many were bullish (closing price higher than the opening price) and bearish.
This function is used to assess the recent trend direction.
Support and Resistance Detection
The script calculates the highest high (highestHigh) and lowest low (lowestLow) over the last lookbackSR (50) periods to identify potential support and resistance levels.
isNearSupport and isNearResistance are conditions to check if the current price is within 0.08% of these identified levels, indicating proximity to support or resistance.
Buy and Sell Logic
Buy Signal:
The RSI crosses over the oversold threshold (30).
The MFI is also below its oversold level (30).
The current price is above the VWAP.
The recent trend (past 20 bars) has been predominantly bearish.
The price is near the identified support level.
Sell Signal:
The RSI crosses under the overbought threshold (70).
The MFI is above its overbought level (70).
The current price is below the VWAP.
The recent trend has been predominantly bullish.
The price is near the identified resistance level.
DUCANH - KELTNER CHANNELS + EMA STRATEGY This is a strategy/combination of warning indicators using 3EMA and Keltner Channels.
I set up this strategy with the aim of reducing analytical labor in the market. When this strategy warns signals, then buy or sell.
This strategy setup works for timeframes, however it can still work for different timeframes.
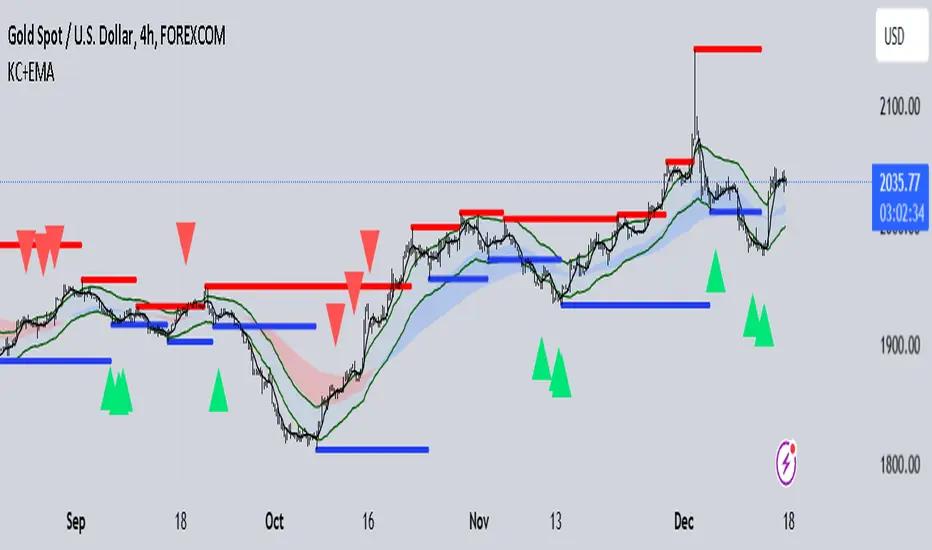
It works well with Gold in various timeframes. If you want to apply it to other currency pairs, you must fine-tune the parameters for maximum efficiency.
The strategy details are as follows:
Ingredient:
EMA50 + EMA120 + SMA
Keltner Channels
Long position Alert:
EMA50 is above EMA120
The candlestick touches the lower KC band
Long position alert will trigger when the candlestick reaches the above conditions and the candlestick starts crossing up to the SMA
Short position Alert:
EMA50 is below EMA120
The candlestick touches the upper KC band
A short position alert will trigger when the candlestick reaches the above conditions and starts crossing down to SMA
Recommended RR: 1:3
If you have any questions please let me know !
COSTAR [SS]This idea came to me after I wrote the post about Co-Integration and pair trading. I wondered if you could use pair trading principles as a way to determine overbought and oversold conditions in a more neutral way than RSI or Stochastics.
The results were promising and this indicator resulted :-)!
About:
COSTAR provides another, more neutral way to determine whether an equity is overbought or oversold.
Instead of relying on the traditional oscillator based ways, such as using RSI, Stochastics and MFI, which can be somewhat biased and narrow sided, COSTAR attempts to take a neutral, unbiased approached to determine overbought and oversold conditions. It does this through using a co-integrated partner, or "pair" that is closely linked to the underlying equity and succeeds on both having a high correlation and a high t-statistic on the ADF test. It then references this underlying, co-integrated partner as the "benchmark" for the co-integration relationship.
How this succeeds as being "unbiased" and "neutral" is because it is responsive to underlying drivers. If there is a market catalyst or just general bullish or bearish momentum in the market, the indicator will be referencing the integrated relationship between the two pairs and referencing that as a baseline. If there is a sustained rally on the integrated partner of the underlying ticker that is holding, but the other ticker is lagging, it will indicate that the other ticker is likely to be under-valued and thus "oversold" because it is underperforming its benchmark partner.
This is in contrast to traditional approaches to determining overbought and oversold conditions, which rely completely on a single ticker, with no external reference to other tickers and no control over whether the move could potentially be a fundamental move based on an industry or sector, or whether it is a fluke or a squeeze.
The control for this giving "false" signals comes from its extent of modelling and assessment of the degree of integration of the relationship. The parameters are set by default to assess over a 1 year period, both the correlation and the integration. Anything that passes this degree of integration is likely to have a solid, co-integrated state and not likely to be a "fluke". Thus, the reliability of the assessment is augmented by the degree of statistical significance found within the relationship. The indicator is not going to prompt you to rely on a relationship that is statistically weak, and will warn you of such.
The indicator will show you all the information you require regarding the relationship and whether it is reliable or not, so you do not need to worry!
How to Use
The first step to use COSTAR is identifying which ticker has a strong relationship with the current ticker. In the main chart, you will see that SPY is overlaid with VIX. There is a strong, negative correlation between the VIX and SPY. When VIX is entered as the paired ticker, the indicator returns the data as stationary, indicating a compatible match.
Now you have 3 ways of viewing this relationship, 2 of which are going to be directly applicable to trading.
You can view them as
Price to Price Ratio (Not very useful for trading, but if you are curious)
Z-Score: Helpful for trading
Co-integration: Helpful for trading
Here is an example of all three:
Example of Z-Score Chart:
Example of Price Ratio:
Example of Co-Integration Pair:
Using for Trading
As stated above, the two best ways to use this for trading is to either use the Z-Score Chart or the Co-Integrated Pair chart.
The Z-Score chart is based off of the price ratio data and provides an assessment of both the independent and dependent data.
The co-integration shows the dependent (the ticker you are trading) in yellow and the independent (the ticker you are referencing) in teal. When teal is above yellow, you will see it is green. This means, based on your benchmark pair, there is still more up room and the ticker you are trading is actually lagging behind.
When the yellow crosses up, it will turn red. This means that your ticker is out-performing the benchmark pair and you likely will see pullback and a "regression to the mean" through re-integration.
The indicator is capable of plotting out entries and exits, which are guided by the z-score:
How Effective is it?
I created a basic strategy in Pinescript, and the back-test results vary. Trading ES1! using NQ1! as the co-integrated pair, results were around 78% effective.
With VIX, results were around 50% effective, but with a net profit.
Generally, the efficacy surpassed that of both stochastics and RSI.
I will be releasing the strategy version of this in the coming days, still just cleaning up that code and making it more "public use" friendly.
Other Applications
If you are a pair trader, you can technically use this for pair trading as well. That's essentially all this is doing :-).
Tips
If you are trading a ticker such as MSFT, AMD, KO etc., it's best to try to find an ETF or index that has that particular ticker as a large holding and use that as your benchmark. You will see on the indicator whether there is a high correlation and whether the data is indeed stationary.
If the indicator returns "Non-stationary", you can attempt to extend your regression range from 252 to 500. If this fixes the issue, ensure that the correlation is still >= 0.5 or <= -0.5. If this does not work still, you will need to find another pair, as its likely the result of incompatibility and an insignificant relationship.
To help you identify tickers with strong relationships, consider using a correlation heatmap indicator. I have one available and I think there are a couple of other similar ish ones out there. You want to make sure the relationship is stable over time (a correlation of >= 0.50 or <= -0.5 over the past 252 to 500 days).
IMPORTANT: The long and short exits delete the signal after one is signaled. Therefore, when you look back in the chart you will notice there are no signals to exit long or short. That is because they signal as they happen. This is to keep the chart clean.
'Tis all my friends!
Hope you enjoy and let me know your questions and suggestions below!
Side note:
COSTAR stands for Co-integration Statistical Analysis and Regression. ;)

MACD_RSI_trend_followingINFO:
This indicator can be used to build-up a strategy for trading of assets which are currently in trending phase.
My preference is to use it on slowly moving assets like GOLD and on higher timeframes, but practice may show that we find more usefull cases.
This script uses two indicators - MACD and RSI, as the timeframe that those are extracted for is configurable (defaults with the Chart TF, but can be any other selected by the user).
The strategy has the following simple idea - buy if any if the conditions below is true:
The selected TF MACD line crosses above the signal line and the TF RSI is above the user selected trigger value
The selected TF MACD line is above the signal line and the TF RSI crosses above the user selected trigger value
Once we're in position we wait for the selected TF MACD line to cross below the signal line, and then we set a SL at the low of that bar
DETAILS and USAGE:
In the current implementation I find two possible use cases for the indicator:
as a stand-alone indicator on the chart which can also fire alerts that can help to determine if we want to manually enter/exit trades based on them
can be used to connect to the Signal input of the TTS (TempalteTradingStrategy) by jason5480 in order to backtest it, thus effectively turning it into a strategy (instructions below in TTS CONNECTIVITY section)
In the example below we see a position opened at the bar after the buy indicator from the script has been triggered, and then later after the SL indicator from the script has been triggered a SL has been set on the lower wick of the closing candle, and the position eventually got closed once the price hit that level. Note that most of the drawing on the example snapshot below are from the TTS indicator following the buy/sell/SL conditions themseves:
Trading period can be selected from the indicator itself to limit to more interesting periods.
Arrow indications are drawn on the chart to indicate the trading conditions met in the script - green arrow for a buy signal indication and orange for LTF crossunder to indicate setting of SL.
SETTINGS:
Leaving all of the settings as in vanilla use case, as both the MACD and RSI indicator's settings follow the default ones for the stand-alone indicators themselves.
The start-end date is a time filter that can be extermely usefull when backtesting different time periods.
Pesonal preference is using the script on a D/W timeframe, while the indicator is configured to use Monthly chart.
The default value of the RSI filter is left to 50, which can be changed. I.e. if the RSI is above 50 we have a regime filter based on the MACD criteria.
EXTERNAL LIBRARIES:
The script uses a couple of external libraries:
HeWhoMustNotBeNamed/enhanced_ta/14 - collection of TA indicators
jason5480/tts_convention/3 - more details about the Template Trading Strategy below
I would like to highly appreciate and credit the work of both HeWhoMustNotBeNamed and jason5480 for providing them to the community.
TTS SETTINGS (NEEDED IF USED TO BACKTEST WITH TTS):
The TempalteTradingStrategy is a strategy script developed in Pine by jason5480, which I recommend for quick turn-around of testing different ideas on a proven and tested framework
I cannot give enough credit to the developer for the efforts put in building of the infrastructure, so I advice everyone that wants to use it first to get familiar with the concept and by checking
by checking jason5480's profile www.tradingview.com
The TTS itself is extremely functional and have a lot of properties, so its functionality is beyond the scope of the current script -
Again, I strongly recommend to be thoroughly epxlored by everyone that plans on using it.
In the nutshell it is a script that can be feed with buy/sell signals from an external indicator script and based on many configuration options it can determine how to execute the trades.
The TTS has many settings that can be applied, so below I will cover only the ones that differ from the default ones, at least according to my testing - do your own research, you may find something even better :)
The current/latest version that I've been using as of writing and testing this script is TTSv48
Settings which differ from the default ones:
from - False (time filter is from the indicator script itself)
Deal Conditions Mode - External (take enter/exit conditions from an external script)
🔌Signal 🛈➡ - MACD_RSI_trend_following: 🔌Signal to TTSv48 (this is the output from the indicator script, according to the TTS convention)
Sat/Sun - true (for crypto, in order to trade 24/7)
Order Type - STOP (perform stop order)
Distance Method - HHLL (HigherHighLowerLow - in order to set the SL according to the strategy definition from above)
The next are just personal preferenes, you can feel free to experiment according to your trading style
Take Profit Targets - 0 (either 100% in or out, no incremental stepping in or out of positions)
Dist Mul|Len Long/Short- 10 (make sure that we don't close on profitable trades by any reason)
Quantity Method - EQUITY (personal backtesting preference is to consider each backtest as a separate portfolio, so determine the position size by 100% of the allocated equity size)
Equity % - 100 (note above)

Dual_MACD_trendingINFO:
This indicator is useful for trending assets, as my preference is for low-frequency trading, thus using BTCUSD on 1D/1W chart
In the current implementation I find two possible use cases for the indicator:
- as a stand-alone indicator on the chart which can also fire alerts that can help to determine if we want to manually enter/exit trades based on the signals from it (1D/1W is good for non-automated trading)
- can be used to connect to the Signal input of the TTS (TempalteTradingStrategy) by jason5480 in order to backtest it, thus effectively turning it into a strategy (instructions below in TTS CONNECTIVITY section)
Trading period can be selected from the indicator itself to limit to more interesting periods.
Arrow indications are drawn on the chart to indicate the trading conditions met in the script - light green for HTF crossover, dark green for LTF crossover and orange for LTF crossunder.
Note that the indicator performs best in trending assets and markets, and it is advisable to use additional indicators to filter the trading conditions when market/asset is expected to move sideways.
DETAILS:
It uses a couple of MACD indicators - one from the current timeframe and one from a higher timeframe, as the crossover/crossunder cases of the MACD line and the signal line indicate the potential entry/exit points.
The strategy has the following flow:
- If the weekly MACD is positive (MACD line is over the signal line) we have a trading window.
- If we have a trading window, we buy when the daily macd line crosses AND closes above the signal line.
- If we are in a position, we await the daily MACD to cross AND close under the signal line, and only then place a stop loss under the wick of that closing candle.
The user can select both the higher (HTF) and lower (LTF) timeframes. Preferably the lower timeframe should be the one that the Chart is on for better visualization.
If one to decide to use the indicator as a strategy, it implements the following buy and sell criterias, which are feed to the TTS, but can be also manually managed via adding alerts from this indicator.
Since usually the LTF is preceeding the crossover compared to the HTF, then my interpretation of the strategy and flow that it follows is allowing two different ways to enter a trade:
- crossover (and bar close) of the macd over the signal line in the HIGH TIMEFRAME (no need to look at the LOWER TIMEFRMAE)
- crossover (and bar close) of the macd over the signal line in the LOW TIMEFRAME, as in this case we need to check also that the macd line is over the signal line for the HIGH TIMEFRAME as well (like a regime filter)
The exit of the trade is based on the lower timeframe MACD only, as we create a stop loss equal to the lower wick of the bar, once the macd line crosses below the signal line on that timeframe
SETTINGS:
All of the indicator's settings are for the vanilla/general case.
User can set all of the MACD parameters for both the higher and lower (current) timeframes, currently left to default of the MACD stand-alone indicator itself.
The start-end date is a time filter that can be extermely usefull when backtesting different time periods.
TTS SETTINGS (NEEDED IF USED TO BACKTEST WITH TTS)
The TempalteTradingStrategy is a strategy script developed in Pine by jason5480, which I recommend for quick turn-around of testing different ideas on a proven and tested framework
I cannot give enough credit to the developer for the efforts put in building of the infrastructure, so I advice everyone that wants to use it first to get familiar with the concept and by checking
by checking jason5480's profile www.tradingview.com
The TTS itself is extremely functional and have a lot of properties, so its functionality is beyond the scope of the current script -
Again, I strongly recommend to be thoroughly epxlored by everyone that plans on using it.
In the nutshell it is a script that can be feed with buy/sell signals from an external indicator script and based on many configuration options it can determine how to execute the trades.
The TTS has many settings that can be applied, so below I will cover only the ones that differ from the default ones, at least according to my testing - do your own research, you may find something even better :)
The current/latest version that I've been using as of writing and testing this script is TTSv48
Settings which differ from the default ones:
- from - False (time filter is from the indicator script itself)
- Deal Conditions Mode - External (take enter/exit conditions from an external script)
- 🔌Signal 🛈➡ - Dual_MACD: 🔌Signal to TTSv48 (this is the output from the indicator script, according to the TTS convention)
- Sat/Sun - true (for crypto, in order to trade 24/7)
- Order Type - STOP (perform stop order)
- Distance Method - HHLL (HigherHighLowerLow - in order to set the SL according to the strategy definition from above)
The next are just personal preferenes, you can feel free to experiment according to your trading style
- Take Profit Targets - 0 (either 100% in or out, no incremental stepping in or out of positions)
- Dist Mul|Len Long/Short- 10 (make sure that we don't close on profitable trades by any reason)
- Quantity Method - EQUITY (personal backtesting preference is to consider each backtest as a separate portfolio, so determine the position size by 100% of the allocated equity size)
- Equity % - 100 (note above)
EXAMPLES:
If used as a stand-alone indicator, the green arrows on the bottom will represent:
- light green - MACD line crossover signal line in the HTF
- darker green - MACD line crossover signal line in the LTF
- orange - MACD line crossunder signal line in the LTF
I recommend enabling the alerts from the script to cover those cases.
If used as an input to the TTS, we'll get more decorations on the chart from the TTS itself.
In the example below we open a trade on the next day of LTF crossover, then a few days later a crossunder in the LTF occurs, so we set a SL at the low of the wick of this day. Few days later the price doesn't recover and hits that SL, so the position is closed.

MA + MACD alert TrendsThis is a strategy/combination of warning indicators using 6MA+MACD.
The strategy details are as follows: This is a simple warning strategy created so that we don't have to monitor the candlestick chart too often.
Note: This isn't an entry strategy; it's a signaling strategy for upcoming trends. For maximum efficiency, we should incorporate more formulas into the command. In the case below, I use Fibonacci to enter the command.
This strategy setting works for a 15-minute time frame, but it can still work for different time frames.
It has been working well with Gold and USOIL for the last two years, as well as with currency pairs like EURUSD and many others.
Components:
EMA100 + EMA200 + MA400 + MA800
MACD (timeframe greater than 1 timeframe)
Fibonacci retreat.
Uptrend alert:
Candles on both EMAs (100-200) + 2 SMAs (400-800)
In the previous 80 candles:
EMA100 cross up to EMA200
At the same time, the MACD cross up 0.
The uptrend warning will trigger when EMA6 cuts down to MA10. That's when the price creates the top and we'll wait for the market to go back to the Fibonacci threshold of 0.618 and start buying (or wait for markets to break up the trendline to buy).
Downtrend alert:
Candles are below both EMAs ( 100-200 ) + 2 SMAs ( 400-800 )
In the previous 80 candles:
EMA100 cross down to EMA200
At the same time, the MACD cross down zero.
The downtrend warning will trigger when EMA6 cuts to MA10. That's when the price creates a bottom and we'll wait for the market to go back to the Fibonacci threshold of 0.618 and start selling (or wait for the market to break down the trendline to sell).
Recommended RR: 1:1
If you have any questions please let me know!

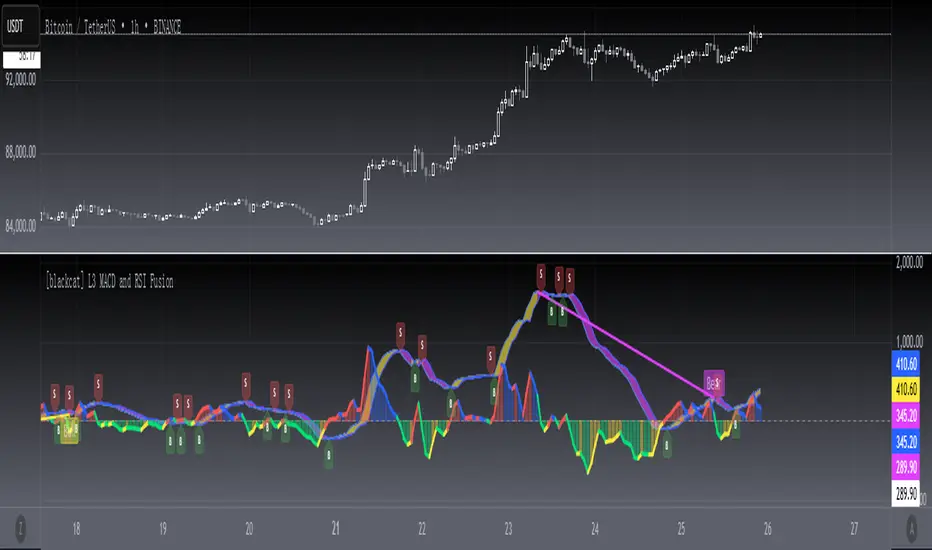
[blackcat] L3 MACD and RSI Fusion The MACD and RSI fusion is a popular technical analysis strategy used by traders to identify buy and sell signals in the market. The strategy makes use of two popular technical indicators, the Moving Average Convergence Divergence (MACD) and the Relative Strength Index (RSI), and combines them to create a powerful trading signal.
The MACD and RSI fusion was originally developed for the Chinese stock market and is commonly used by traders all over the world. The strategy is based on the idea that the MACD and RSI indicators can be used together to provide a more accurate and reliable signal.
To use the MACD and RSI fusion , traders need to follow a few simple steps. The following code is the TradingView Pine script v4 indicator equivalent of the original MACD and RSI fusion code:
```
//@version=4
study(" MACD and RSI fusion ", overlay=false)
// Define the simple fusion indicator
simple_fusion = (ema(close, 12) - ema(close, 26)) * 1.2 + rsi(close, 14) / 50
// Define the simple fusion lag indicator
simple_fusion_lag = nz(simple_fusion )
// Plot the simple fusion and simple fusion lag indicators
plot(simple_fusion, color=color.blue, title="simple fusion")
plot(simple_fusion_lag, color=color.red, title="simple fusion Lag")
```
This code defines the simple fusion and simple fusion Lag indicators and plots them on the chart. The simple fusion indicator is the sum of the 12- and 26-period exponential moving averages of the closing price, multiplied by 1.2, and added to the 14-period relative strength index of the closing price, divided by 50. The simple fusion Lag indicator is the value of the simple fusion indicator from the previous period.
Traders can use the simple fusion and simple fusion Lag indicators to identify buy and sell signals. When the simple fusion indicator crosses above the simple fusion Lag indicator, it is a buy signal, and when the simple fusion indicator crosses below the simple fusion Lag indicator, it is a sell signal.
In conclusion, the MACD and RSI fusion is a simple but powerful technical analysis strategy that combines two popular technical indicators to identify buy and sell signals in the market.
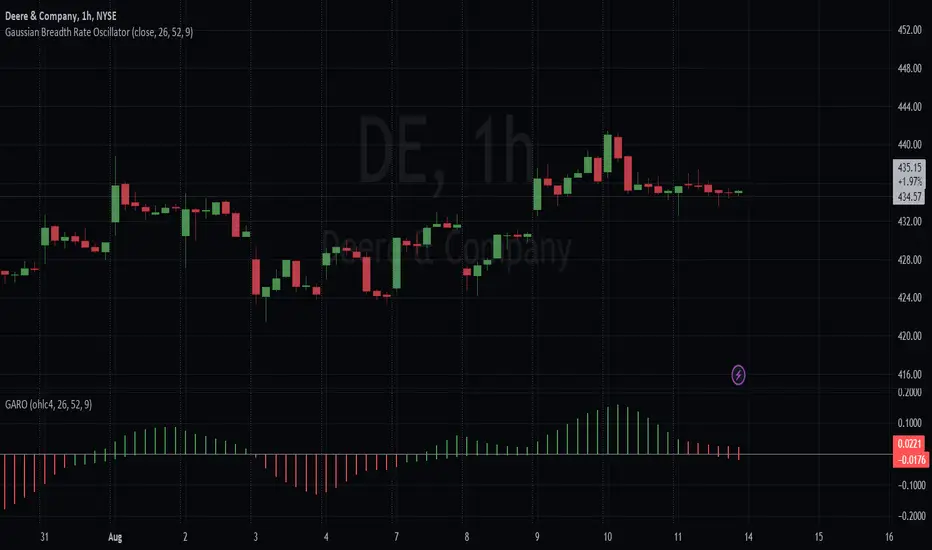
Gaussian Average Rate Oscillator
Within the ALMA calculation, the Gaussian function is applied to each price data point within the specified window. The idea is to give more weight to data points that are closer to the center and reduce the weight for points that are farther away.
The strategy calculates and compares two different Rate of Change (ROC) indicators: one based on the Arnaud Legoux Moving Average (ALMA) and the other based on a smoothed Exponential Moving Average (EMA). The primary goal of this strategy is to identify potential buy and sell signals based on the relationship between these ROC indicators.
Here's how the strategy logic works
Calculating the ROC Indicators:
The script first calculates the ROC (Rate of Change) of the smoothed ALMA and the smoothed EMA. The smoothed ALMA is calculated using a specified window size and is then smoothed further with a specified smoothing period. The smoothed EMA is calculated using a specified EMA length and is also smoothed with the same smoothing period.
Comparing ROCs:
The script compares the calculated ROC values of the smoothed ALMA and smoothed EMA.
The color of the histogram bars representing the ROC of the smoothed ALMA depends on its relationship with the ROC of the smoothed EMA. Green indicates that the ROC of ALMA is higher, red indicates that it's lower, and black indicates equality.
Similarly, the color of the histogram bars representing the ROC of the smoothed EMA is determined based on its relationship with the ROC of the smoothed ALMA, they are simply inversed so that they match.
With the default color scheme, green bars indicate the Gaussian average is outperforming the EMA within the breadth and red bars mean it's underperforming. This is regardless of the rate of average price changes.
Generating Trade Signals:
Based on the comparison of the ROC values, the strategy identifies potential crossover points and trends. Buy signals could occur when the ROC of the smoothed ALMA crosses above the ROC of the smoothed EMA. Sell signals could occur when the ROC of the smoothed ALMA crosses below the ROC of the smoothed EMA.
Additional Information:
The script also plots a zero rate line at the zero level to provide a reference point for interpreting the ROC values.
In summary, the strategy attempts to capture potential buy and sell signals by analyzing the relationships between the ROC values of the smoothed ALMA and the smoothed EMA. These signals can provide insights into potential trends and momentum shifts in the price data.
Greedy DCA█ OVERVIEW
Detect price crashes in volatile conditions. This is an indicator for a greedy dollar cost average (DCA) strategy. That is, for people who want to repeatedly buy an asset over time when its price is crashing.
█ CONCEPTS
Price crashes are indicated if the price falls below one or more of the 4 lower Bollinger Bands which are calculated with increasing multipliers for the standard deviation.
In these conditions, the price is far below the average. Therefore they are considered good buying opportunities.
No buy signals are emitted if the Bollinger Bands are tight, i.e. if the bandwidth (upper -lower band) is below the value of the moving average multiplied with a threshold factor. This ensures that signals are only emitted if the conditions are highly volatile.
The Bollinger Bands are calculated based on the daily candles, irrespective the chart time frame. This allows to check the strategy on lower time frames

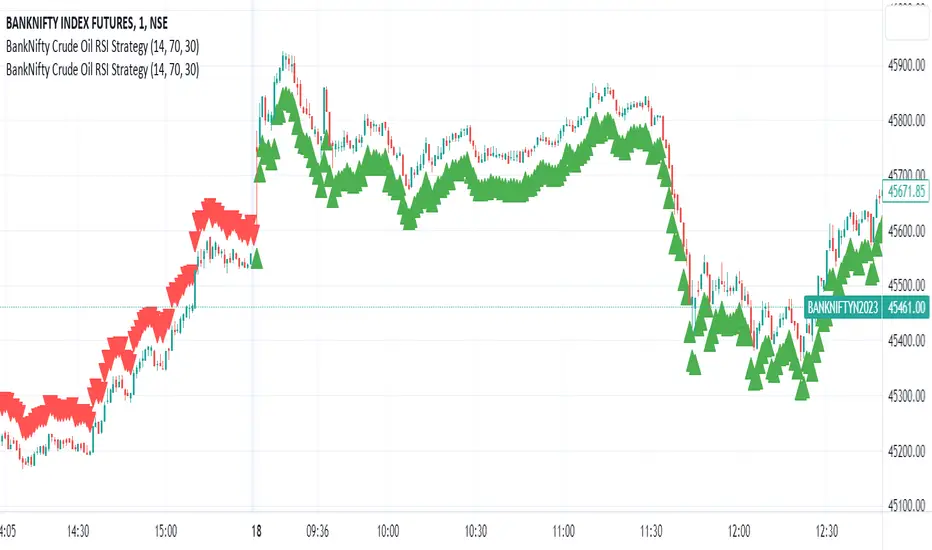
BankNifty Crude Oil RSI Strategy
The "BankNifty Crude Oil RSI Strategy" is a trading strategy that combines the BankNifty index with the WTI Crude Oil price index using the Relative Strength Index (RSI) as the primary indicator. The strategy aims to generate buy and sell signals based on the RSI of the Crude Oil price index, which might influence the BankNifty index.
Here's how the strategy works step by step:
Data Fetching:
The strategy fetches the daily closing prices of WTI Crude Oil from the provided TradingView link "TVC:USOIL" using the request.security function.
RSI Calculation:
The Relative Strength Index (RSI) is calculated using the closing prices of WTI Crude Oil. The RSI is a momentum oscillator that measures the speed and change of price movements. It oscillates between 0 and 100, indicating overbought conditions when above a specified threshold (overbought level) and oversold conditions when below a specified threshold (oversold level).
Buy and Sell Conditions:
The strategy defines two conditions based on the RSI values:
Buy Signal: When the Crude Oil RSI falls below a specified rsiOversold level (default is 30), the strategy generates a buy signal. This implies that the Crude Oil is in an oversold condition, and there might be a potential buying opportunity in the BankNifty index.
Sell Signal: When the Crude Oil RSI rises above a specified rsiOverbought level (default is 70), the strategy generates a sell signal. This implies that the Crude Oil is in an overbought condition, and there might be a potential selling opportunity in the BankNifty index.
Buy and Sell Signal Visualization:
The strategy uses the plotshape function to plot triangular shapes (upward for buy and downward for sell) below and above the price bars, respectively, to indicate the buy and sell signals on the chart visually.
EMA Envelope - Signal with Stoploss and Takeprofit LevelsDescription:
This Pine Script indicator implements the EMA Envelope strategy, which utilizes Exponential Moving Averages (EMA) to create an envelope around the price chart. The strategy generates buy and sell signals based on the crossing of the price above and below the upper and lower EMA envelopes, respectively. It also incorporates additional features such as stop-loss and take-profit levels for risk management.
Indicator Settings:
EMA Length: Specifies the period for the short-term Exponential Moving Average.
Long Term EMA Length: Defines the period for the long-term Exponential Moving Average used for signal filtering.
Take Profit Ratio: Determines the ratio for calculating the take-profit levels based on the stop-loss.
Filter Signal on Long Term EMA: Enables or disables the filtering of buy/sell signals using the long-term EMA.
Show only recent signal: When enabled, shows only the most recent buy/sell signals.
Buy and Sell Signals:
The indicator generates buy signals when the price crosses above the upper EMA envelope and the previous low was below the upper EMA envelope. Additionally, you can choose to filter buy signals based on whether the closing price is above the long-term EMA.
Conversely, sell signals are generated when the price crosses below the lower EMA envelope, and the previous high was above the lower EMA envelope. Similar to buy signals, sell signals can also be filtered using the long-term EMA.
Note: Signal works well on Higher Timeframes like Daily/8hrs/4hrs/1hr.
Stop-Loss and Take-Profit Levels:
For buy signals, the stop-loss is set at the lower EMA level, while the take-profit level is calculated by adding a specified ratio of the difference between the low and the stop-loss level to the low price.
For sell signals, the stop-loss is set at the upper EMA level, and the take-profit level is calculated by subtracting a specified ratio of the difference between the stop-loss level and the high price from the high price.
Disclaimer:
This indicator is provided for educational and informational purposes only. Trading involves significant risk, and past performance does not guarantee future results. Users are solely responsible for their trading decisions and should conduct their own research and risk management. The author shall not be held liable for any losses or damages arising from the use of this indicator.
Note: Always test the indicator thoroughly on historical data and consider paper trading before applying it to live trading environments.

kyle algo v1
Integration of multiple technical indicators: The strategy mainly combines two technical indicators - Keltner Channels and Supertrend, to generate trading signals. It also calculates fifteen exponential moving averages (EMAs) for the high price with different periods ranging from 9 to 51.
Unique combination of indicators: The traditional Supertrend typically uses Average True Range (ATR) to calculate its upper and lower bands. In contrast, this script modifies the approach to use Keltner Channels instead.
Flexible sensitivity adjustment: This strategy provides a "sensitivity" input parameter for users to adjust, which controls the multiplier for the range in the Supertrend calculation. This can make the signals more or less sensitive to price changes, allowing users to tailor the strategy to their own risk tolerance and trading style.
EMA Energy Representation: The code offers a visualization of "EMA Energy", which color-codes the EMA lines based on whether the closing price is above or below the EMA line. This can provide an intuitive understanding of market trends.
Clear visual signals: The strategy generates clear "BUY" and "SELL" signals, represented as labels on the chart. This makes it easy to identify potential entry and exit points in the market.
Customizable: The script provides several user inputs, making it possible to fine-tune the strategy according to different market conditions and individual trading preferences.
EMA (Exponential Moving Average) Principle:
The EMA is a type of moving average that assigns more weight to the most recent data.
It responds more quickly to recent price changes and is used to capture short-term price trends.
Principle of Color Change :
In this trading strategy, the color of the EMA line changes based on whether the closing price is above or below the EMA. If the closing price is above the EMA, the EMA line turns green,
indicating an upward price trend. Conversely, if the closing price is below the EMA, the EMA line turns red,
indicating a downward price trend. These color changes help traders to more intuitively identify price trends
In short, our team provides a lot of practical space
That is your development space

Binary Option Strategy Tester with Martingale-Basic V.2In Binary options, strategy testing is a bit different. The strategy result depends upon expiry intervals and payout ratio.
My previous script was a try to resolve this but has some bugs in specific choices. The new version overcame those and added some new features useful for binary option strategy testing.
Assumption:
We are opening position at next candle after signal come
Chart interval is option expiry time.
We are taking the position at opening price
Our call will be profitable if we get a green candle and put will be profitable if we get a red candle
We can open only one trade at a time. So if we are in trade, subsequent signals will be ignored.
All Input Options:
Test Call/Put individually or both. Default BOTH
Select up to 5 Martingale levels. Default 2
Type of Martingale Trade. Default “SAME”
“SAME”: If you are trading CALL and incur a loss, you are taking CALL in subsequent Martingale levels.
“OPSITE”: if you are trading CALL and incur a loss, you are taking PUT in subsequent Martingale levels.
“FOLLOW CANDLE COLOR”: You are following candle color in Martingale levels, i.e if the loss candle is RED, you are taking PUT in subsequent candles.
“OPPOSITE CANDLE COLOR”: You are taking opposite candle color trade, i.e if the loss candle is RED, you are taking CALL in subsequent candle.
Select Specific Trading Session. Please select “USE SPECIFIC SESSION”. Default: TRUE
Put the investment amount per option. Default: 10
Payout ratio. Default: 80%
The strategy is taken from Vdub Binary Options SniperVX v1 (by @vdubus). I have deleted extra parts and kept only the necessary parts.
Result Table
Signal and Win Levels:
Signal and Loss:
Please note that Binary options trading is very risky. You must be aware of the risk and be willing to accept them in order to invest in binary options. Only invest what you can afford to lose. The past performance of any trading system, strategy, or methodology is not necessarily indicative of future results.

SA 2.0The 100/200 EMA crossover strategy is a popular trend-following strategy used in technical analysis. It aims to identify potential buy and sell signals based on the crossover of two exponential moving averages (EMAs), specifically the 100-period EMA and the 200-period EMA. This strategy is designed to capture the momentum of the market and take advantage of sustained trends in the price of US30. This strategy can also work on other instruments, just backtest the winrate.
How it Works:
Timeframe Selection: The strategy is optimized for the US30 index and is implemented on both the 5-minute and 3-minute charts. These shorter timeframes provide more frequent trading opportunities and allow for quicker decision-making.
EMA Crossover: The strategy focuses on the crossover of the 100-period EMA and the 200-period EMA. When the 100 EMA crosses above the 200 EMA, it generates a bullish signal, indicating a potential upward trend. Conversely, when the 100 EMA crosses below the 200 EMA, it generates a bearish signal, suggesting a potential downward trend.
Rejection Confirmation: To filter out false signals and increase the reliability of the strategy, it incorporates a rejection confirmation. After the initial crossover, the strategy looks for price rejections near the 100 EMA. A rejection occurs when the price briefly moves below the 100 EMA and then quickly bounces back above it, indicating potential support and a possible continuation of the trend. It is during this rejection that the strategy generates the buy or sell signal.
Buy and Sell Signals: When a rejection occurs after the crossover, the strategy generates a buy signal if the rejection is above the 100 EMA. This suggests that the price is likely to continue its upward momentum. On the other hand, a sell signal is generated if the rejection occurs below the 100 EMA, indicating a potential continuation of the downward trend. These signals help traders identify favorable entry points for long or short positions.
Risk Management: As with any trading strategy, proper risk management is crucial. Traders can use stop-loss orders to limit potential losses in case the market moves against their positions. Additionally, setting profit targets or trailing stops can help secure profits as the trend progresses.
It's important to note that no trading strategy guarantees success, and it's recommended to test the strategy on historical data or in a demo trading environment before applying it with real funds. Furthermore, regular monitoring and adjustment may be necessary to adapt to changing market conditions.
Disclaimer: This description is for informational purposes only and should not be considered as financial advice. Trading carries risks, and individuals should exercise caution and consult with a qualified financial professional before making any investment decisions.
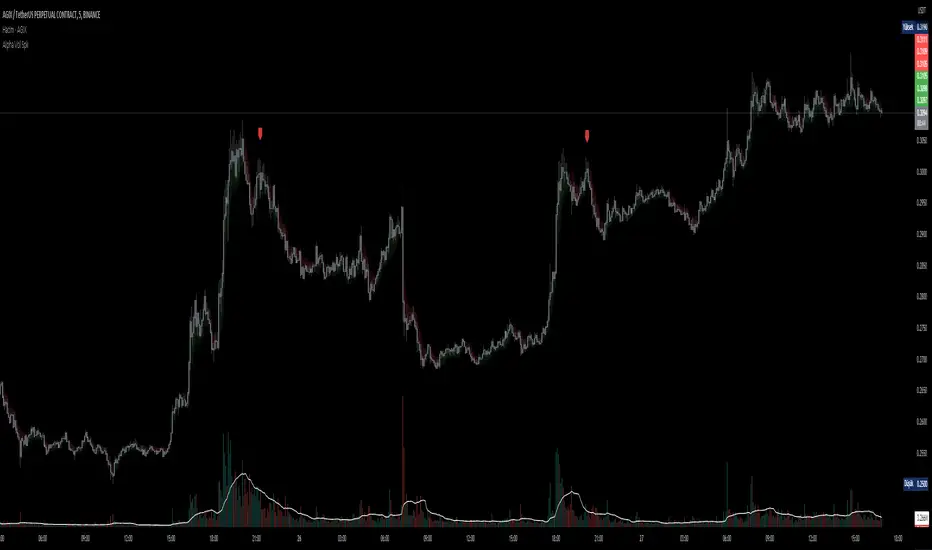
D-BoT Alpha Volume SpikeHello traders, Let me explain the code and provide an example of how to trade using this indicator.
The code you provided is a Pine Script indicator that combines multiple technical indicators, such as Supertrend, ADX, RSI, and MFI, to generate buy and sell signals. Here's a breakdown of the code:
User Settings:
The user can adjust parameters like overbought_limit, oversold_limit, volume_multiplier, volume_ma_length, volume_spike_multiple, lookback_period, and use_extremities_confirmation according to their preference.
Calculate Supertrend:
The Supertrend indicator is calculated using three different ATR lengths (supertrend_atr_period1, supertrend_atr_period2, supertrend_atr_period3) and corresponding factors (supertrend_factor1, supertrend_factor2, supertrend_factor3).
The supertrend_value1, supertrend_value2, and supertrend_value3 represent the Supertrend values, while trend_direction1, trend_direction2, and trend_direction3 indicate the trend direction (negative for downtrend, positive for uptrend).
Candle calculations:
The high and low values are checked to identify bullish and bearish candles based on specific conditions.
Volume Spikes:
Volume spikes are detected by comparing the current volume with a median volume over a specified lookback period.
If the volume exceeds a certain multiple of the median volume and the DI+ value is greater than the DI- value, an "up" signal is generated. Similarly, if the DI- value is greater than the DI+ value, a "down" signal is generated.
Additional Filters (RSI and MFI):
Relative Strength Index (RSI) and Money Flow Index (MFI) are used as additional filters.
The RSI and MFI parameters can be adjusted according to the user's preference.
The signals generated by the volume spikes are filtered based on RSI and MFI conditions.
Plotting:
The indicator plots shapes (triangles) to represent buy and sell signals.
The Supertrend lines are plotted using different colors and transparency levels based on the distance from the current price.
The "bodyMiddle" plot is used for filling the area between the Supertrend lines.
Example Trade Scenario:
Let's consider an example trade scenario using this indicator:
When the indicator generates an "up" signal (trendBuy = true), indicating a potential bullish trend, and all the confirmation conditions (RSI, MFI, Supertrend) are met, you can consider opening a long position.
Conversely, when the indicator generates a "down" signal (trendSell = true), indicating a potential bearish trend, and all the confirmation conditions are met, you can consider opening a short position.
Remember, this is just an example, and it's crucial to perform thorough analysis and consider other factors before making trading decisions. It's recommended to backtest the strategy, assess risk management, and apply appropriate position sizing techniques.
Please note that the code provided is a simplified version, and there might be additional factors and considerations specific to your trading strategy that are not included in this code. *******"I have also reviewed the following indicators, and the volume calculation approaches of my friends have been very helpful in creating this indicator: "Volume Spikes " © tradeforopp and "Volume Spikes & Growing Volume Signals With Alerts & Scanner" © FriendOfTheTrend."*******
Enhanced Strategy (Buy/Sell Signals)The provided script is an enhanced strategy that combines multiple indicators to generate buy and sell signals. Here's a breakdown of its features and usage:
Indicators used:
1. Moving Averages (MA): It uses two moving averages, fast and slow, to identify trend direction.
2. Relative Strength Index (RSI): It measures the momentum and overbought/oversold conditions of the asset.
3. Moving Average Convergence Divergence (MACD): It indicates trend direction and potential trend reversals.
4. Stochastic Momentum Index (Stch Mtm): It identifies overbought and oversold conditions and potential reversals.
5. Awesome Oscillator: It helps to gauge the market momentum and potential trend changes.
How to use:
1. The strategy is designed to be used as a study on the TradingView platform.
2. Apply the script to your preferred chart and adjust the input parameters as desired.
3. The buy and sell signals will be plotted as green "Buy" and red "Sell" labels on the chart.
4. You can also observe the plotted indicators to gain insights into the market conditions.
Combination of indicators:
1. Buy Signal: The strategy generates a buy signal when the following conditions are met:
- The fast moving average crosses over the slow moving average (bullish crossover).
- RSI value is above the specified threshold (30 by default), indicating potential oversold conditions.
- MACD line is above the signal line, suggesting a bullish trend.
- Stch Mtm is above 50, indicating bullish momentum.
- The Awesome Oscillator is positive, implying bullish market sentiment.
2. Sell Signal: The strategy generates a sell signal when the following conditions are met:
- The fast moving average crosses under the slow moving average (bearish crossover).
- RSI value is below the specified threshold (100 - RSI threshold), indicating potential overbought conditions.
- MACD line is below the signal line, suggesting a bearish trend.
- Stch Mtm is below 50, indicating bearish momentum.
- The Awesome Oscillator is negative, implying bearish market sentiment.
Market conditions:
- The strategy aims to identify potential entry and exit points based on the combination of indicators.
- It can be used in various market conditions, but it's important to consider the overall market context, news events, and risk management principles.
- It's recommended to use this strategy as a tool for analysis and decision-making, and validate the signals with additional analysis before executing trades.
Please note that the effectiveness and profitability of any trading strategy can vary depending on various factors, including market conditions and individual trading preferences. It's always advisable to conduct thorough backtesting and consider risk management techniques before applying any strategy to live trading.
